Introduction
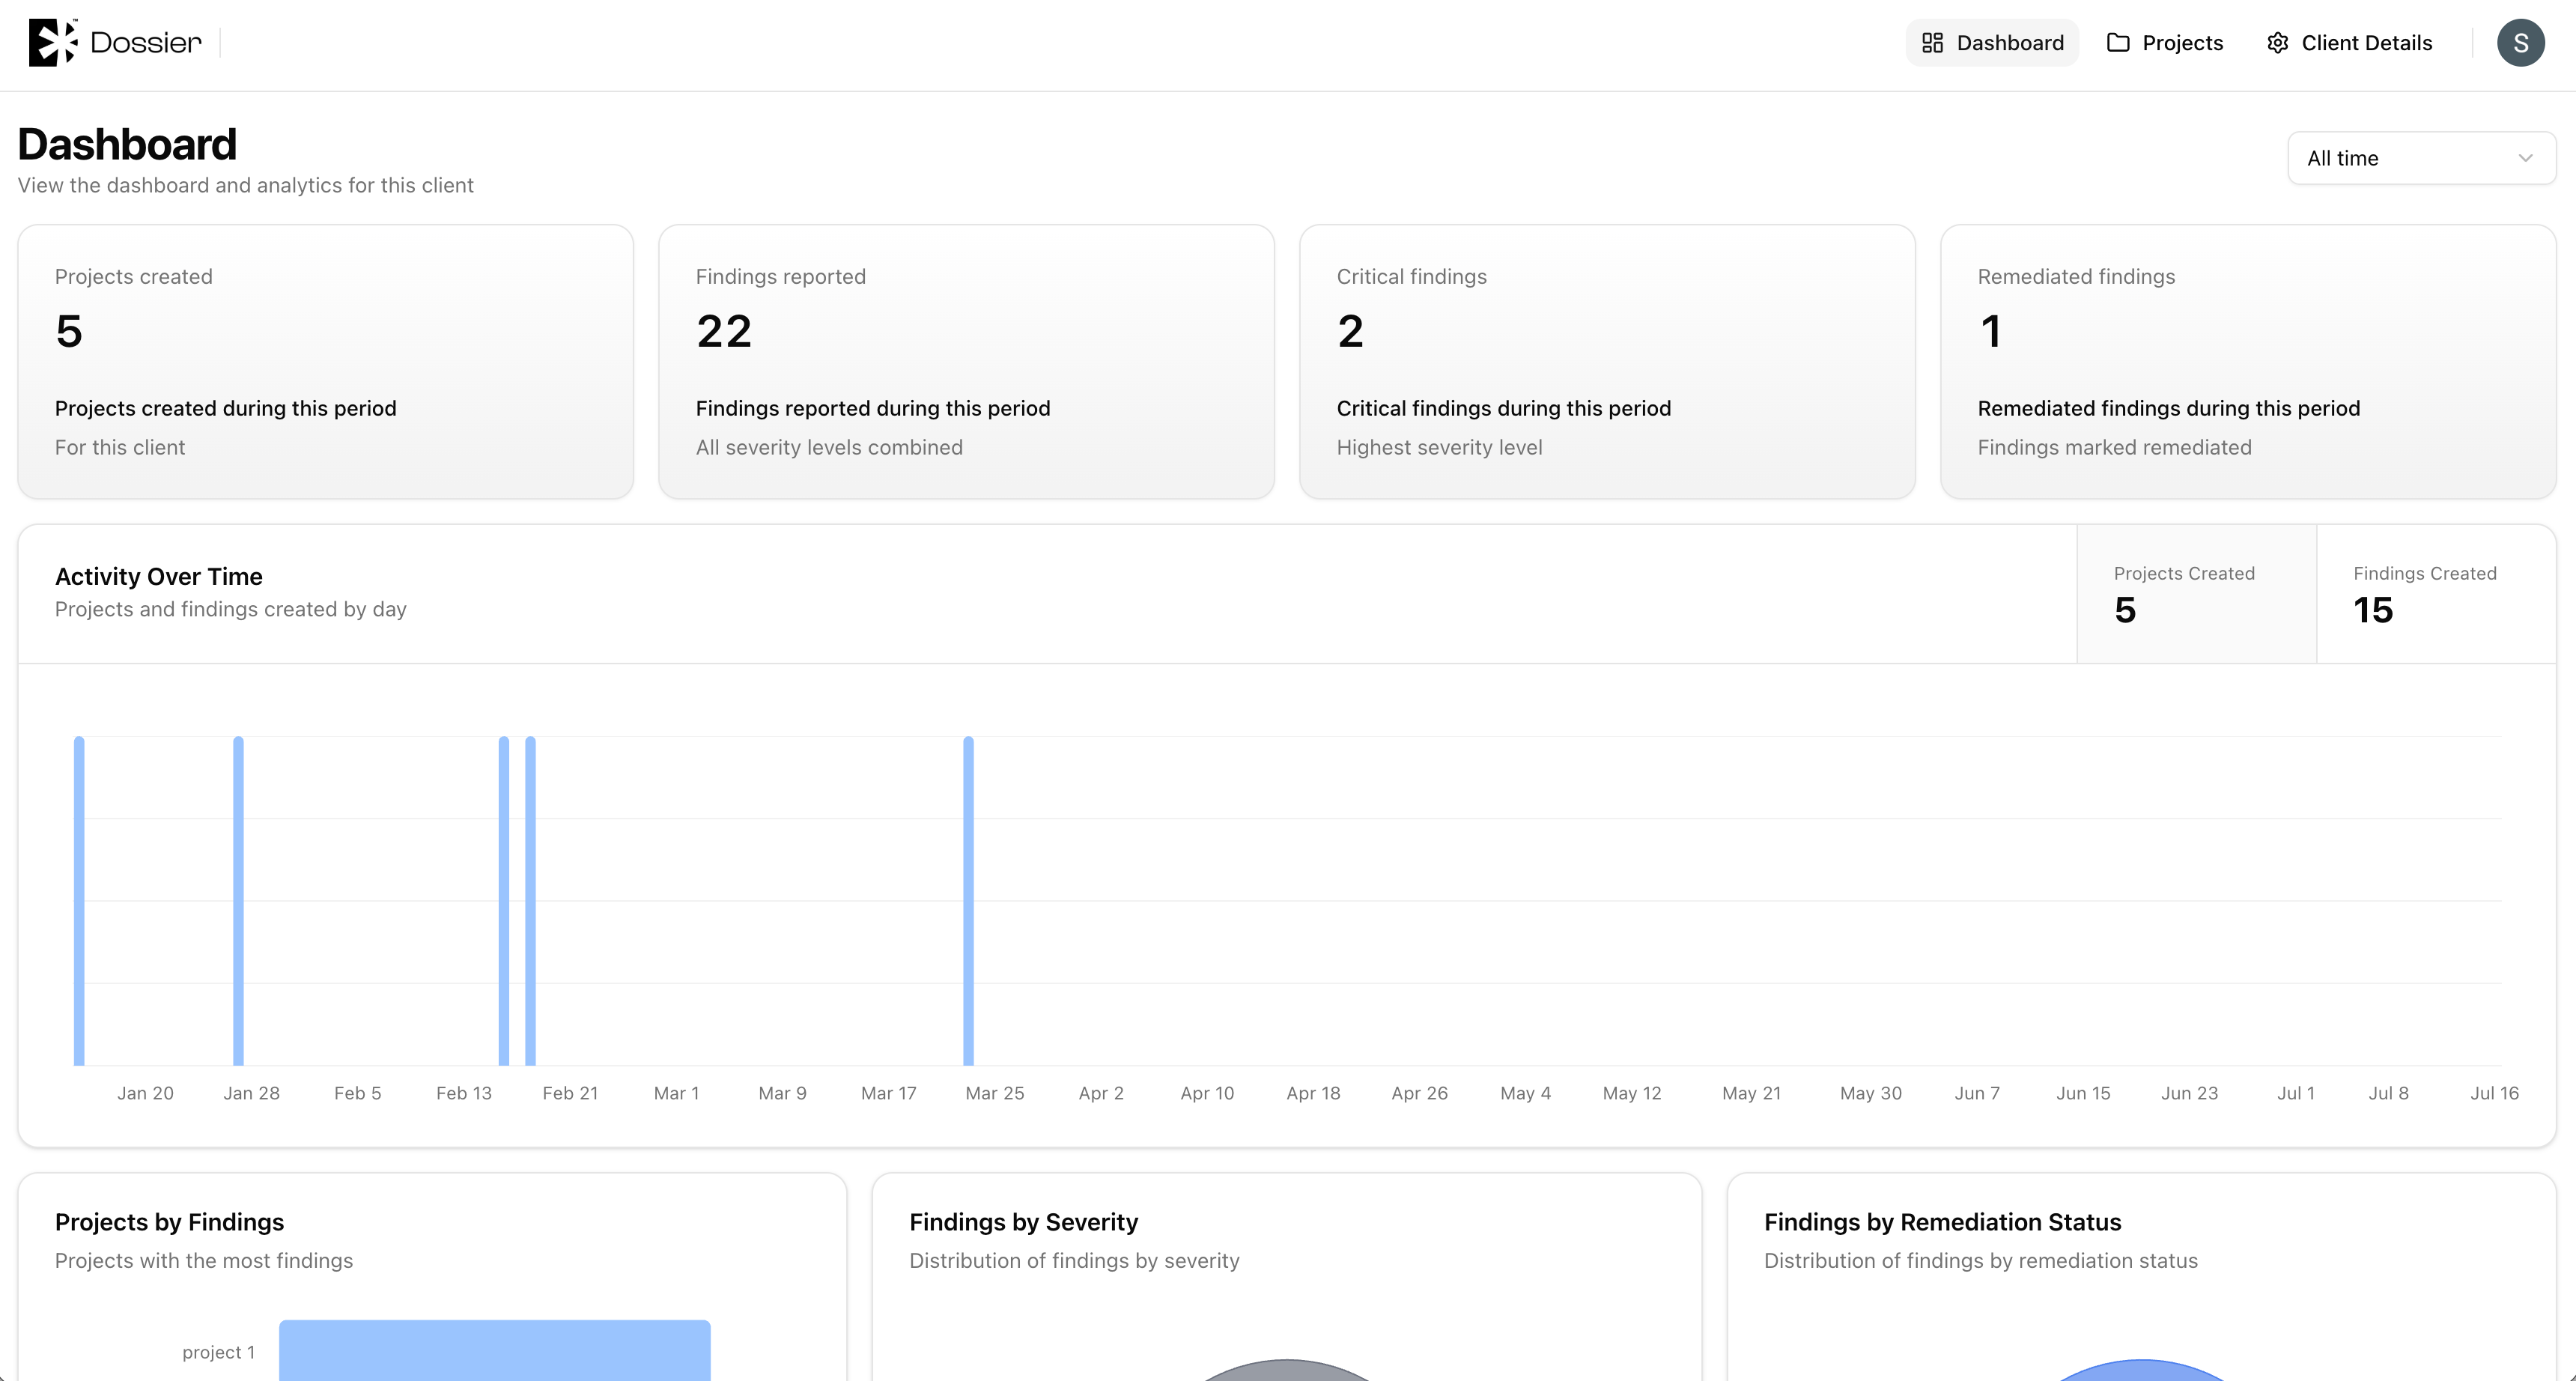
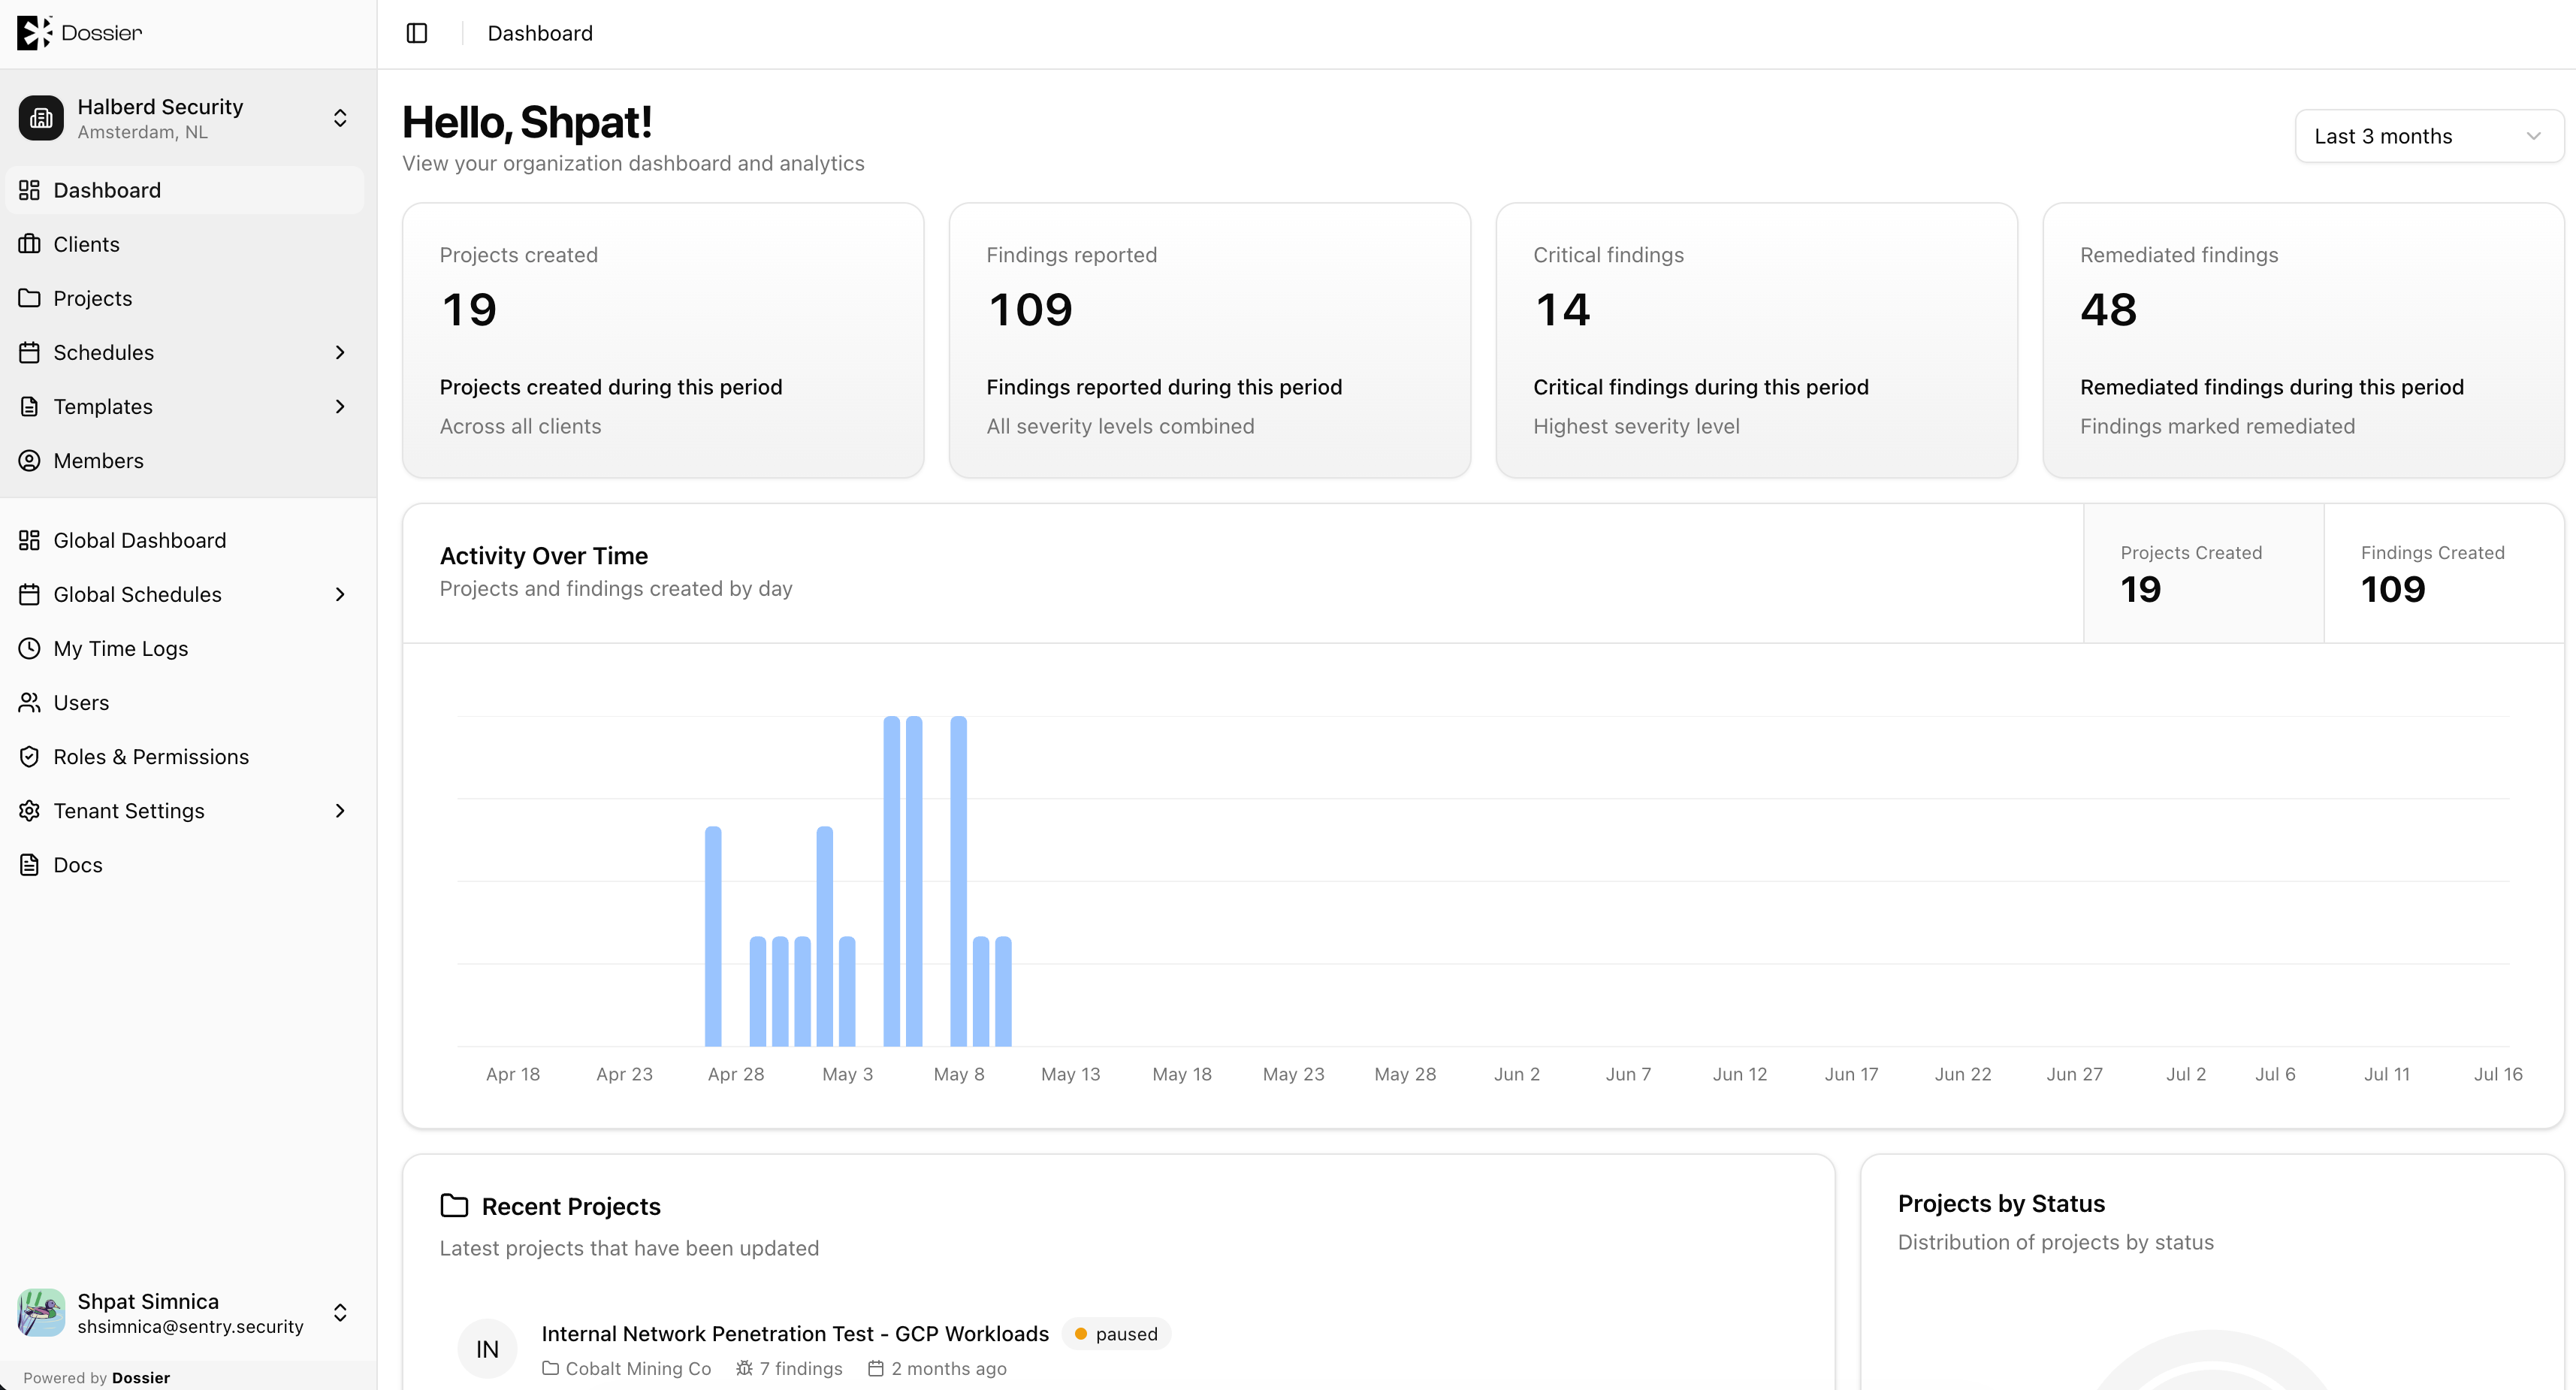
Dossier provides dashboards at three levels to give you visibility into security engagements:
| Dashboard | Scope | Route |
|---|---|---|
| Organization dashboard | All data within the selected organization | /org/:id/dashboard |
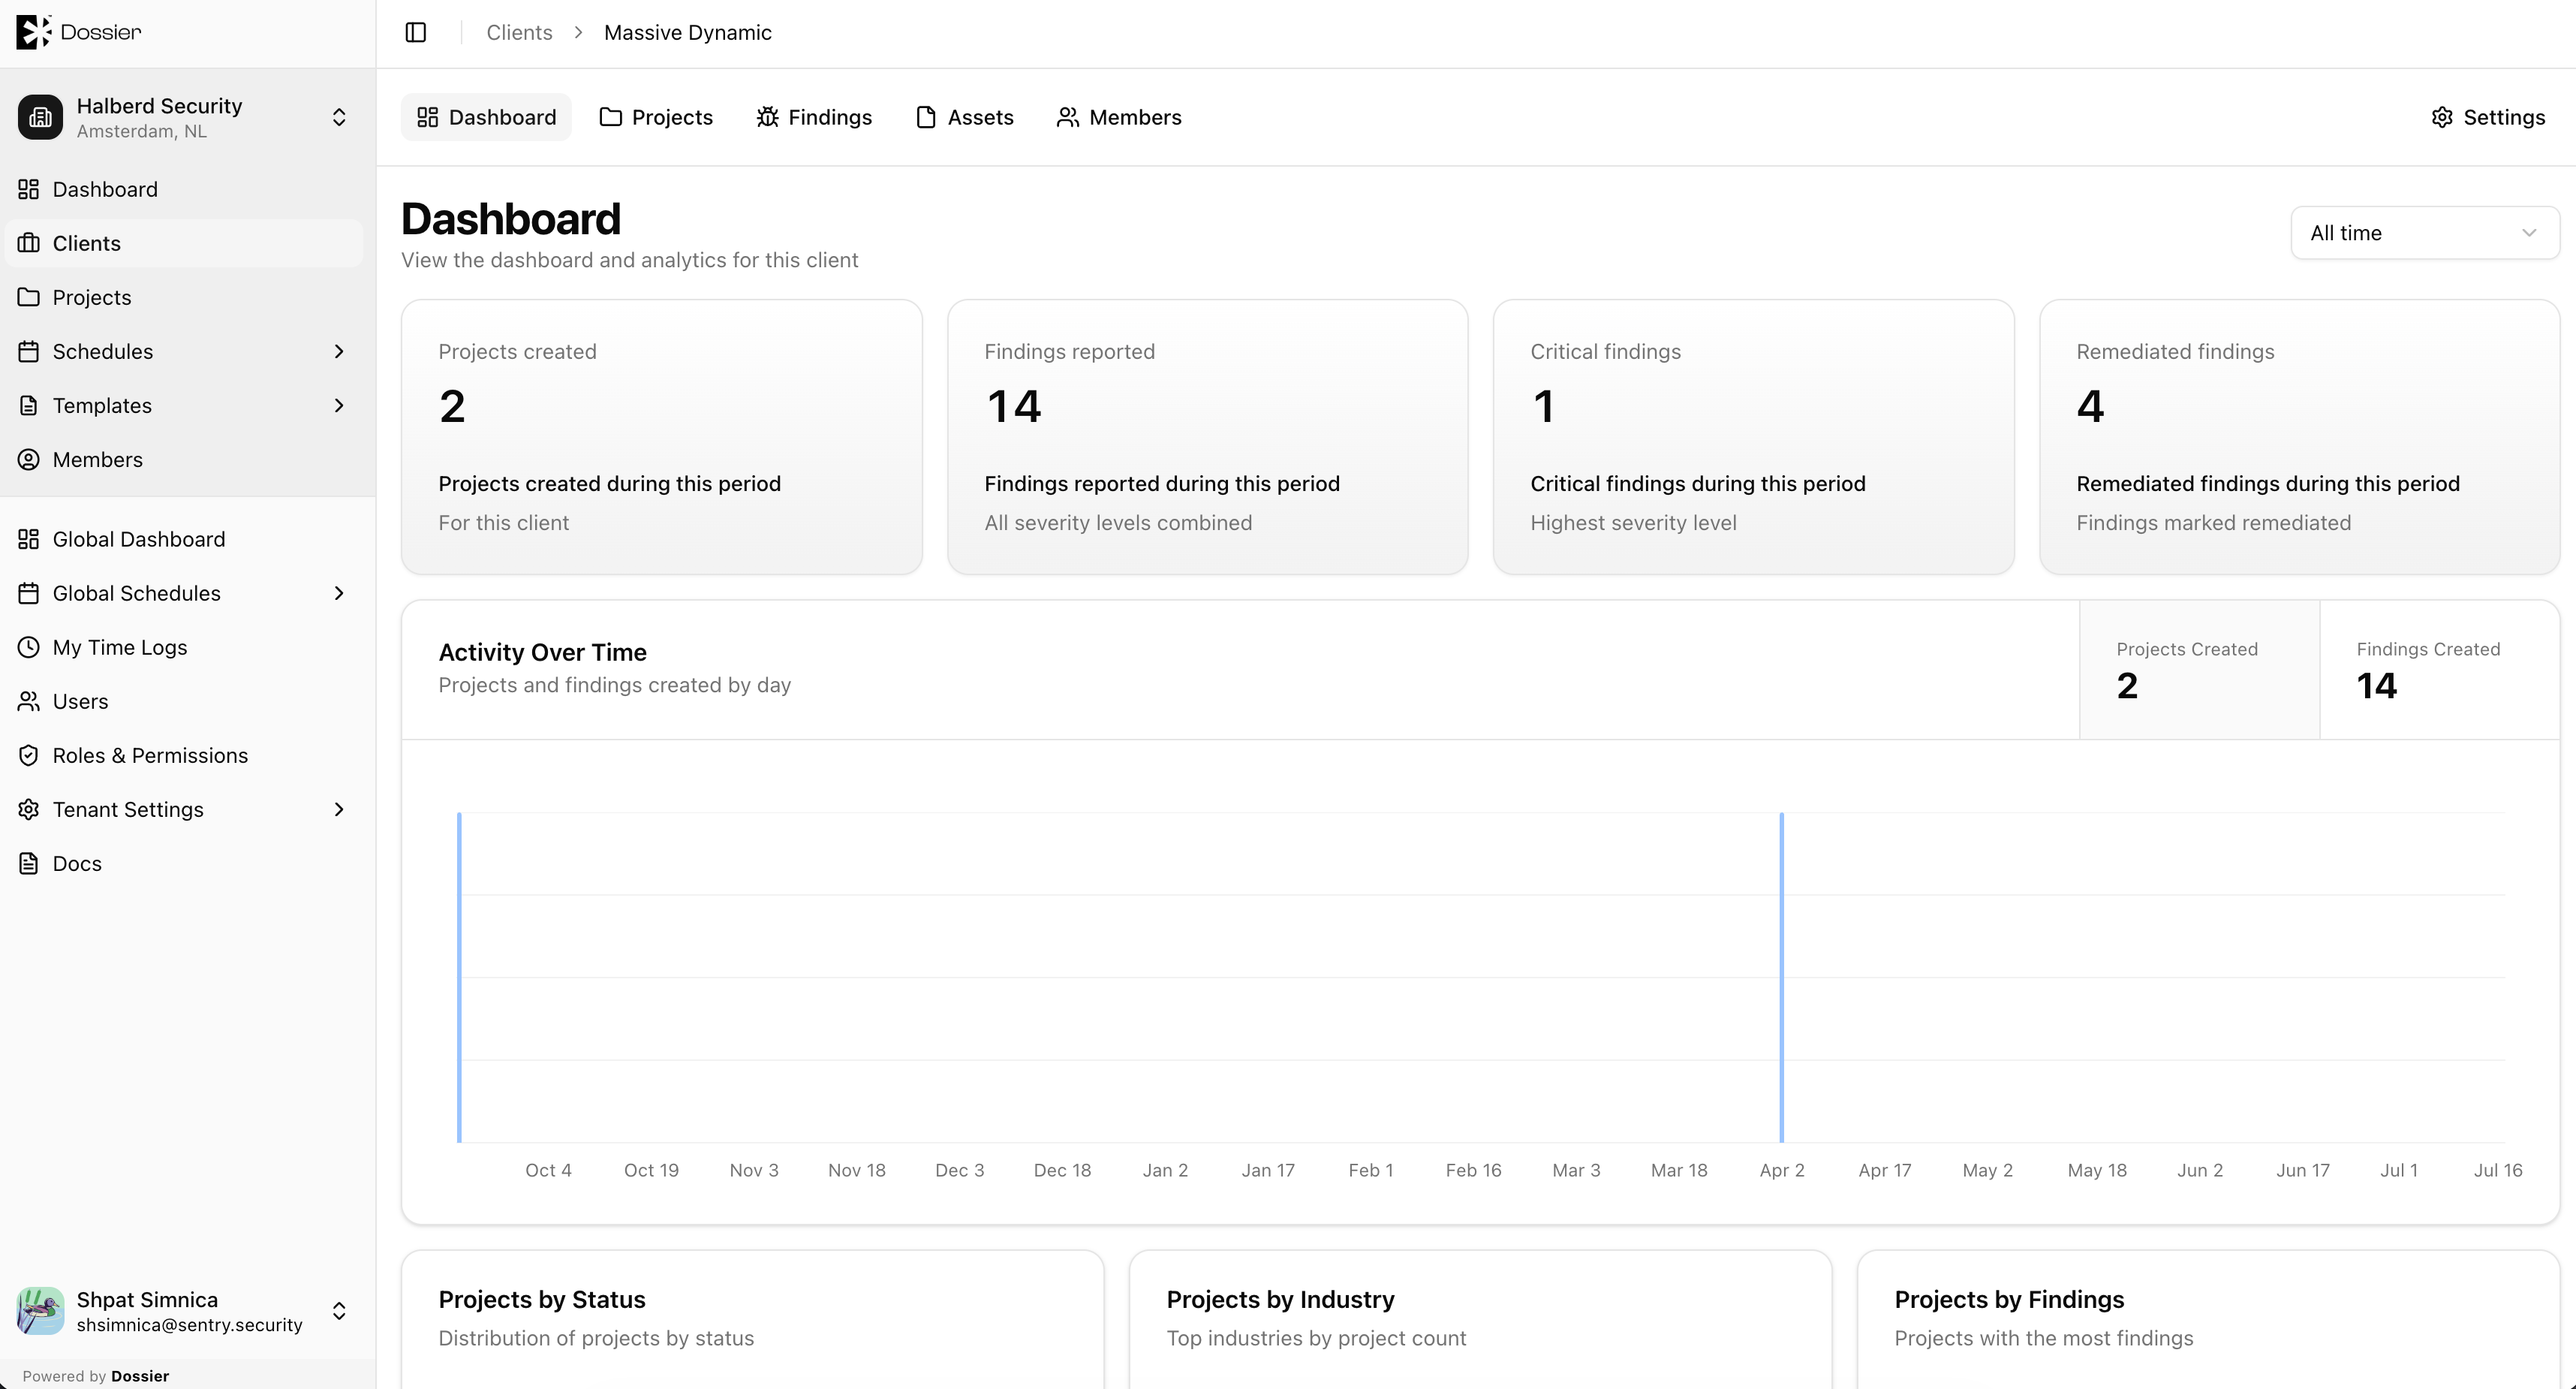
| Client dashboard | All data for a single client | /org/:id/clients/:clientId/dashboard |
| Project dashboard | Data for a single project | /org/:id/projects/:projectId/dashboard |
| Global dashboard | All data across the entire tenant | /global/dashboard |
Each dashboard includes summary cards, charts, and recent activity feeds. You can filter most widgets by date range.
What Each Dashboard Shows
Summary cards
- Total projects, findings, and assets
- Counts broken down by status or severity
Charts
- Projects by status — Radial chart showing draft, planned, active, paused, completed, and canceled projects.
- Findings by severity — Distribution across Critical, High, Medium, Low, and Informational.
- Remediation status — Open, remediated, partially remediated, and not remediated counts.
- Recent activity — Bar chart of activity over the selected time range.
Recent lists
- Recently updated projects
- Recently created or updated findings
- Recent activity feed (status changes, comments, etc.)
Client Portal Visibility
Client accounts see a simplified dashboard scoped to their client. Draft projects and findings are hidden from client views. Statistics labels may differ slightly from the team view.